Points of Interest
A live heatmap built from anonymous nearby reports
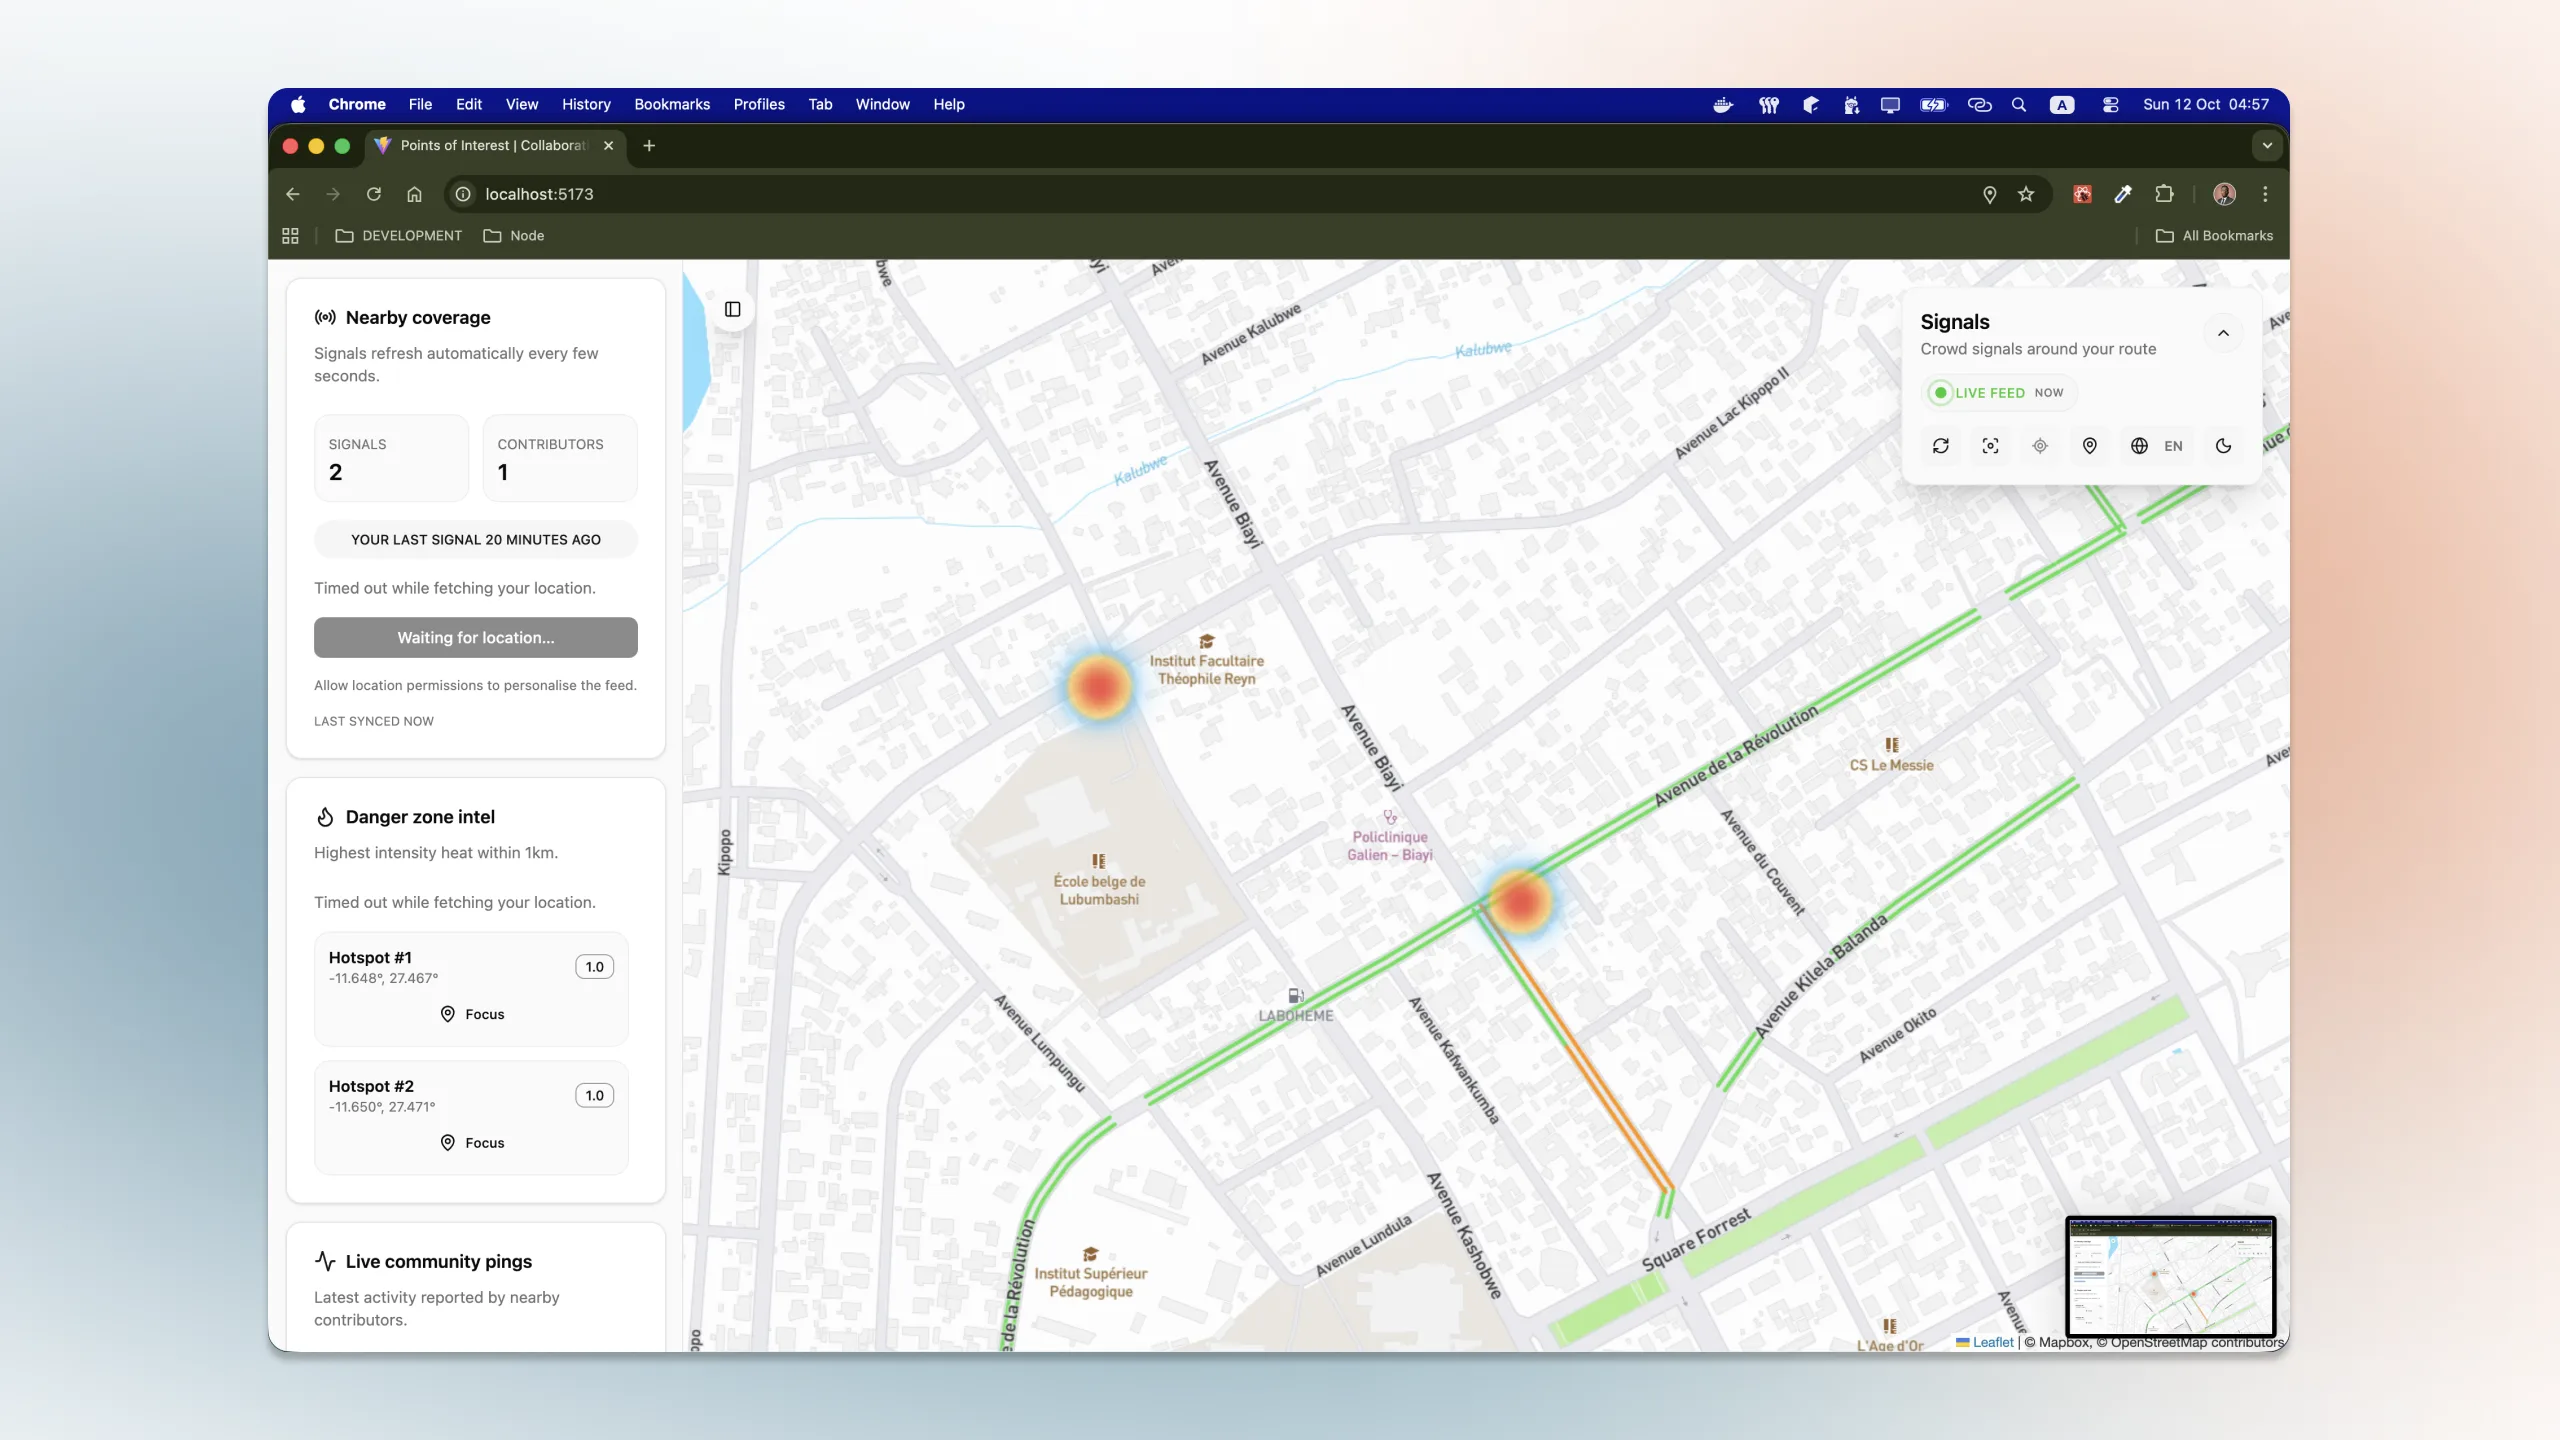
Points of Interest is a proof of concept for mapping temporary local activity. A person can report a nearby point without creating an account. The application validates the distance, stores the report, and updates a shared heatmap in real time.
I built it to test whether small anonymous reports can show where activity is building without exposing a public user profile.
The problem
Most maps describe places that remain in roughly the same location. This project deals with activity that may last minutes or hours, such as a crowd forming in one area.
Most mapping applications organize data around fixed places:
But many real-world signals are temporary.
A place can become active for a short period. A zone can become crowded. A location can become relevant because multiple people report it around the same time.
That type of information is not static. It is collective, recent, and local.
Points of Interest explores a simple question:
Can anonymous nearby signals be transformed into a useful real-time map of local activity?
That question creates several technical challenges:
How do users submit a signal quickly?

How do we avoid requiring authentication?

How do we prevent spam or abusive submissions?

How do we validate that a signal is actually near the user?

How do we aggregate raw points into useful hotspot data?

How do we update every connected client in real time?

How do we keep the interface understandable on top of a dense map?
A basic marker map would not be enough.
The system needed to collect signals, validate them, store them, aggregate them, stream updates, and render them as a clear geospatial interface.
That turned Points of Interest from a simple map demo into a full-stack real-time mapping system.
Product direction
The first brief was short:
Let people anonymously report nearby activity and visualize the result as a live heatmap.
That idea quickly became more interesting because the product needed to balance participation, privacy, and signal quality.
A useful version of the system needed to:
-
detect or request the user's current location;
-
allow the user to submit a nearby point from the map;
-
validate that the submitted point is close enough to the user;
-
identify contributors without accounts;
-
rate-limit submissions per anonymous client;
-
store raw signals with timestamps;
-
aggregate recent signals into density cells;
-
expose snapshots through an API;
-
broadcast live updates to connected clients;
-
display hotspots, recent activity, and contributor statistics;
-
keep the interface usable without requiring authentication.
The product direction was intentionally lightweight.
The user should not need to create an account, fill a long form, or understand a complex reporting model. They should open the app, allow location access, tap the map, confirm the signal, and immediately see the shared map update.
System architecture
Points of Interest uses five parts:
React and Leaflet handle map interaction. The API receives signals and returns snapshots. Validators check rate and distance. PostgreSQL stores accepted signals. Mercure sends each new snapshot to connected clients.
The system follows this flow:
Each accepted submission follows that sequence once before every client receives the new snapshot.
Backend API layer
The backend is a Symfony API responsible for receiving signals, returning snapshots, and coordinating live updates.
The API exposes one central resource:
/api/signalsIt supports two main operations:
GET  /api/signals  -> return a recent signal snapshot

POST /api/signals  -> submit a new signal
The controller delegates client identification, snapshots, and submissions to separate services:
The controller translates HTTP requests into calls to those services.
Snapshot endpoint
The GET /api/signals endpoint returns a snapshot of recent activity.
The snapshot includes:
clientKey

points

density

latestByUser

totals

updatedAt
The response contains heatmap cells, contributor count, recent activity, and the current client's state. The frontend does not aggregate raw database rows.
Submission endpoint
The POST /api/signals endpoint accepts a signal payload containing:
signalLocation

userLocation
That distinction matters.
The backend uses the user's current location to validate proximity. The signal location is the point they want to report. Those two coordinates may differ.
For example, a user may be standing near a place and submit a signal slightly ahead of them on the map.
The backend checks whether that submitted point is within the allowed range before storing it.
Domain model
At the center of the backend is the Signal entity.
A signal represents one anonymous report submitted by a user.
The entity stores:
id

userKey

userLocation

signalLocation

createdAt
The system stores an anonymous contributor key, the submitted point, the user's approximate position at submission time, and the timestamp. It does not create a user account, profile, password, or social identity.
Anonymous participation layer
The prototype accepts reports without authentication.
Users can participate without creating an account.
Instead of storing identity, the backend derives an anonymous client key from the request IP address.
The derived client key supports:
rate limiting

latest signal by contributor

contributor statistics

user-specific latest signal
without forcing users to register.
It is a pragmatic privacy tradeoff for a proof of concept.
The system does not claim to provide perfect anonymity. IP-derived identifiers still affect privacy, especially if an operator retains logs or raw addresses. For this prototype, the identifier avoids a public account while supporting rate limits.
Validation layer
Crowdsourced systems become useless if submissions are too easy to abuse.
Points of Interest handles this with two backend protections:
rate limiting

proximity validation
Rate limiting
Each anonymous client key passes through Symfony's rate limiter before a signal is accepted.
The goal is simple:
One person should not be able to flood the map with fake activity.
The rate limiter rejects repeated submissions from the same client key during the configured interval.
Proximity validation
The backend also checks that the submitted signal is close enough to the user's actual location.
The proximity check prevents a client from reporting an arbitrary remote location.
The validation flow looks like this:
The distance is calculated using a haversine-style distance function.
The backend accepts a report only when the calculated distance is within the configured radius.
Snapshot and aggregation layer
Raw signals are useful for storage, but they are not enough for visualization.
The frontend needs a higher-level representation:
Where are the points?

Where is activity dense?

Who submitted recently?

How many contributors are active?

When was the map last updated?
The snapshot builder turns recent signals into a compact response.
The density aggregation groups signals by rounded coordinates and increments an intensity counter per bucket.
That produces heatmap-ready cells:
lat

lng

intensity
This is a smart design for the prototype because the frontend can render density without doing expensive grouping work itself.
The backend owns aggregation. The frontend owns visualization.
Real-time layer
Points of Interest uses Mercure to broadcast live signal updates.
After the repository stores a signal, the backend dispatches a message. A handler rebuilds the recent snapshot and publishes it to a Mercure topic.
Connected clients subscribe through Server-Sent Events.
Connected clients receive the same updated snapshot without polling.
A user submits a signal, and other connected users can see the heatmap update without refreshing the page.
That is the difference between a static map and a live crowd map.
Frontend map layer
The frontend is a React and Vite application built around a Leaflet map.
Its job is to turn the backend snapshot into an interactive geospatial interface.
The main UI pieces are:
map viewport

heatmap layer

user location marker

confirmation dialog

header overlay

sidebar panels

recent activity feed

hotspot list

status and error feedback
The frontend flow looks like this:
The frontend keeps the complex parts separated into hooks.
That is a strong architectural choice because map rendering, live data, derived statistics, and UI state are all different concerns.
Leaflet heatmap
The map layer uses Leaflet and leaflet.heat to render density cells as a heatmap.
The heatmap receives backend-generated density cells and normalizes intensity values before rendering them.
The client also supports map tile providers, including OpenStreetMap and Mapbox-style tiles.
The result is more useful than showing individual markers only.
Markers show events. Heatmaps show patterns.
That distinction is the heart of the project.
Interaction design
Submitting a report takes these steps:
The application does not ask for a name, email, password, profile, or category.
That is the right call for this prototype.
The prototype asks only for the location needed to test anonymous participation.
Confirmation before submission
A map click does not immediately submit a signal.
It opens a confirmation dialog first.
That small interaction matters because map clicks can be accidental. Confirming the point gives the user a chance to verify the location before contributing to the shared heatmap.
Local radius filtering
The frontend focuses on nearby activity.
It filters visible density cells, points, and latest-user signals around the user's current location.
The client hides density cells and reports outside the configured radius.
For this prototype, locality is the product.
Data flow
The complete application data flow looks like this:
This flow connects the map interaction to validation, storage, aggregation, and live updates.
It turns individual reports into a shared, live spatial view.
API contract
The API contract contains one snapshot read and one signal write.
A snapshot response contains:
interface Snapshot {

  clientKey?: string;

  points: Signal[];

  density: SignalDensityCell[];

  latestByUser: Signal[];

  totals: {

    points: number;

    contributors: number;

  };

  updatedAt: string;

}
A signal contains:
interface Signal {

  id: string;

  signalLocation: Point;

  createdAt: string;

  userKey: string;

}
A density cell contains:
interface SignalDensityCell {

  lat: number;

  lng: number;

  intensity: number;

}
Each response field maps to a heatmap, feed, counter, or client marker in the interface.
The frontend does not need to understand database rows. It receives exactly the data needed for:
map points

heatmap cells

contributor count

recent activity

latest signal by user

last update time
Infrastructure layer
The local infrastructure uses Docker Compose for the supporting services.
The backend uses:
Symfony 7

PHP 8.4

Doctrine ORM

PostgreSQL / PostGIS

Mercure

Adminer
The frontend uses:
React

TypeScript

Vite

Leaflet

leaflet.heat

Zustand

i18next

Sonner

Tailwind-style UI components
The infrastructure can be summarized like this:
This stack fits the project well.
Symfony validates requests and dispatches messages. React renders the interface. Leaflet renders the map. Mercure streams snapshots. PostgreSQL/PostGIS stores signals and coordinates.
Quality and CI
The repository includes quality checks for both backend and frontend.
The backend quality workflow runs:
PHPStan

ECS coding standards

PHPUnit
The frontend quality workflow runs:
ESLint

Prettier

TypeScript type checking
The proof of concept includes repeatable builds and tests because it spans an API, database, message transport, and map client.
The repository runs separate checks for the PHP backend and React client.
Backend and frontend changes trigger separate checks.
Server changes trigger PHP checks. Client changes trigger Node checks, so each change runs only the relevant tools.
Key engineering decisions
Build the product around live snapshots
The project does not stream individual low-level database events to the frontend.
Instead, it streams updated snapshots.
That is a good choice for this prototype because the UI wants the current state of the map, not a complex event log.
A snapshot gives the frontend a simple truth:
Here are the current points.

Here is the current density.

Here are the current contributors.

Here is the latest update time.
Keep users anonymous
The application avoids authentication completely.
That lowers friction and makes the prototype easier to use.
The anonymous client key still gives the system enough structure for rate limiting and contributor statistics, but without introducing account management.
That is the right tradeoff for a crowdsourced local signal experiment.
Validate proximity on the backend
The frontend can guide the user, but the backend must enforce the rule.
Points of Interest checks the distance between the user location and the submitted signal location on the server.
That prevents the client from becoming the source of truth.
Never trust the browser for this kind of validation. That would be dumb.
Separate submission from visualization
Submission and visualization are separate flows.
A user submits one signal. The system rebuilds the snapshot. Every client receives the updated view.
The request flow remains:
Use heatmaps instead of only markers
Individual markers are useful, but they do not communicate density well.
Heatmaps reveal patterns.
For a crowdsourced hotspot system, density is the product. The heatmap is not decoration. It is the main interface.
Use dedicated frontend hooks
The React code separates concerns through hooks:
useUserLocation

useHotspotFeed

useLeafletHeatmap

useFeedDerivations

useAppStore
Each hook owns one stateful concern, such as geolocation, Mercure, derived feed data, or the Leaflet instance.
Map lifecycle, Mercure subscriptions, derived hotspot lists, geolocation, and UI state should not all live in one giant component.
Use Mercure for real-time updates
Mercure is a strong fit for this use case because the frontend only needs server-to-client updates.
The client does not need a full bidirectional WebSocket protocol. Server-Sent Events are enough.
The client only opens a server-to-client event stream.
Keep the API contract UI-friendly
The API returns density cells, latest signals by user, totals, and updated timestamps directly.
The frontend renders those prepared fields without recomputing density.
The backend prepares the data. The frontend presents it.
What I learned
The main lesson from Points of Interest is that the map is only the last step. The application first has to reject distant or repeated submissions, group raw coordinates into density cells, deliver updates, and keep the interface readable.
I also learned that anonymity changes the architecture.
Without accounts, the system still needs a way to distinguish contributors, enforce limits, and show "my latest signal." An anonymous client key is enough for this prototype. It is not a claim of strong anonymity, and it would need a clearer threat model before use with sensitive reports.
The project also showed that raw points are not useful on their own. The snapshot service turns them into density cells, contributor totals, and recent activity that the interface can render without repeating the aggregation logic.
Current state
The proof of concept covers anonymous client keys, proximity checks, rate limits, persistence, density snapshots, Mercure updates, and heatmap rendering. It demonstrates the full reporting loop, but it does not yet establish whether people will submit enough accurate reports to make the map useful.
The next test should focus on the product risk, not another framework. I would recruit a small group in one area, define one reporting use case, and measure accuracy, participation, latency, and abuse.